Opened 12 years ago
Last modified 10 years ago
#344 accepted task
ROPP and L2 handling
| Reported by: | Ian Culverwell | Owned by: | Stig Syndergaard |
|---|---|---|---|
| Priority: | normal | Milestone: | DMI ROPP developments |
| Component: | ropp_pp | Version: | 7.0 |
| Keywords: | CDAAC, ROPP | Cc: |
Description
KBL writes:
Hi Ian

I have reviewed the paper by Wang et al, submitted to JGR, where they compare
ROPP against CDAAC processing of some COSMIC data. They looked at: Input data
set: ~20000 COSMIC profiles over the Australian region from 2010 CDAAC: Data
version v2010.2640 (produced by CDAAC 3.0) ROPP: ROPP-6.0 processing from CDAAC
phases to atm and dry quantities

Their results show rather large differences, much larger than what was reported
in Gorbunov et al (JTECH 2011) and Lewis' GSR-13 (2010), between CDAAC and ROPP
data so I think they must have done something wrong (maybe related to mixing
different height coordinates...). This is part of my report: "Fig. 6 in the
present manuscript shows a large bias between CDAAC and ROPP in disagreement
with the previous investigations. This bias is linearly increasing over the full
height range and, furthermore, has a different sign for bending angles and
refractivities which does not agree with the (naive) expectation that the sign
of this bias cannot change under the Abel transform (which links these two
quantities). The reason for this different behavior is not explained and this
should be further investigated and characterized before this manuscript can be
published. I therefore ask the authors to revise their manuscript before I can
recommend publication."

However, in their paper they also show one example of a profile ("event 2")
which is treated different regarding the L2 smoothing in the CDAAC and ROPP
processing. This is the one in Fig. 2 (see attached file). This is also shown in
Fig. 3, together with "event 1" (which is a rising example). The retrieved
quantities for event 1 and 2 are shown in Fig. 4.

I discussed this issue with Stig and we think that this case (event 2) should be
checked more carefully since maybe the way ROPP treats this case is not so good
(or maybe it is ok, but it has to be checked). Please raise a ROPP ticket
related to this and assign it to the next release. This issue may be linked to
one of the things Stig has on his list of "ROPP issues" so he will probably be
discussing this further with you.

Thank you
Kent
Attachments (5)
Change history (9)
by , 12 years ago
| Attachment: | Preprint_CDACCvsROPP_figs2-4.pdf added |
|---|
comment:1 by , 12 years ago
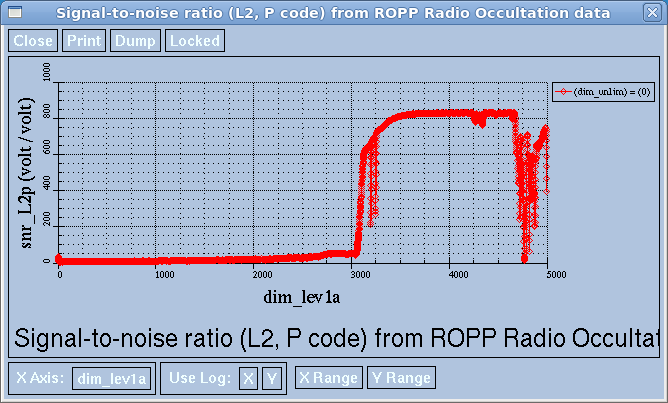
I can reproduce SNR_L2P figure for atmPhs_C006.2010.002.06.40.G02_2010.2640_nc by running
/data/nwp1/idculv/ROPP/ropp_src/branches/dev/Share/ROPP80_prototype/ropp_io/tools/ucar2ropp
atmPhs_C006.2010.002.06.40.G02_2010.2640_nc -o
atmPhs_C006.2010.002.06.40.G02_2010.2640.nc
followed by
/data/nwp1/idculv/ROPP/ropp_src/branches/dev/Share/ROPP71_prototype/ropp_pp/tools/ropp_pp_occ_tool
atmPhs_C006.2010.002.06.40.G02_2010.2640.nc -o
atmPhs_C006.2010.002.06.40.G02_2010.2640_cntl.nc -mfile  MSIS_coeff.nc -c
cosmic_pp.cf -ellipsoid -d -m GMSIS  >
atmPhs_C006.2010.002.06.40.G02_2010.2640_cntl.out
Obviously I don't know precisely which MSIS, ellipsoid etc options they used. But the above 2 commands produce
SNR_L2P atmPhs_C006.2010.002.06.40.G02_2010.2640

which is very close to what's shown in Fig 2 of the attached (The occultation lasts ~100 s.)
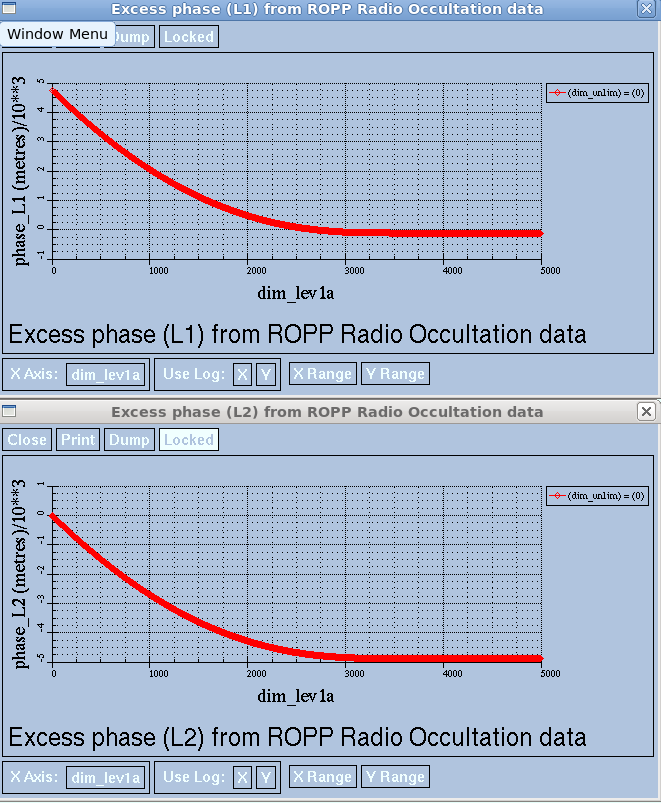
The resulting excess phases are
Phase_L1/2 atmPhs_C006.2010.002.06.40.G02_2010.2640

which is very close to what's shown in Fig 3 of the attached, after you realise that the event 1 and 2 labels have been erroneously swapped around in that figure. (Event 2, atmPhs_C006.2010.002.06.40.G02_2010.2640, is a rising occultation.) (I double checked this by plotting the excess phases for the setting occultation Event 1, atmPhs_C006.2010.003.21.09.G19_2010.2640. They are indeed what has been wrongly described as Event 2 in Fig 3.)
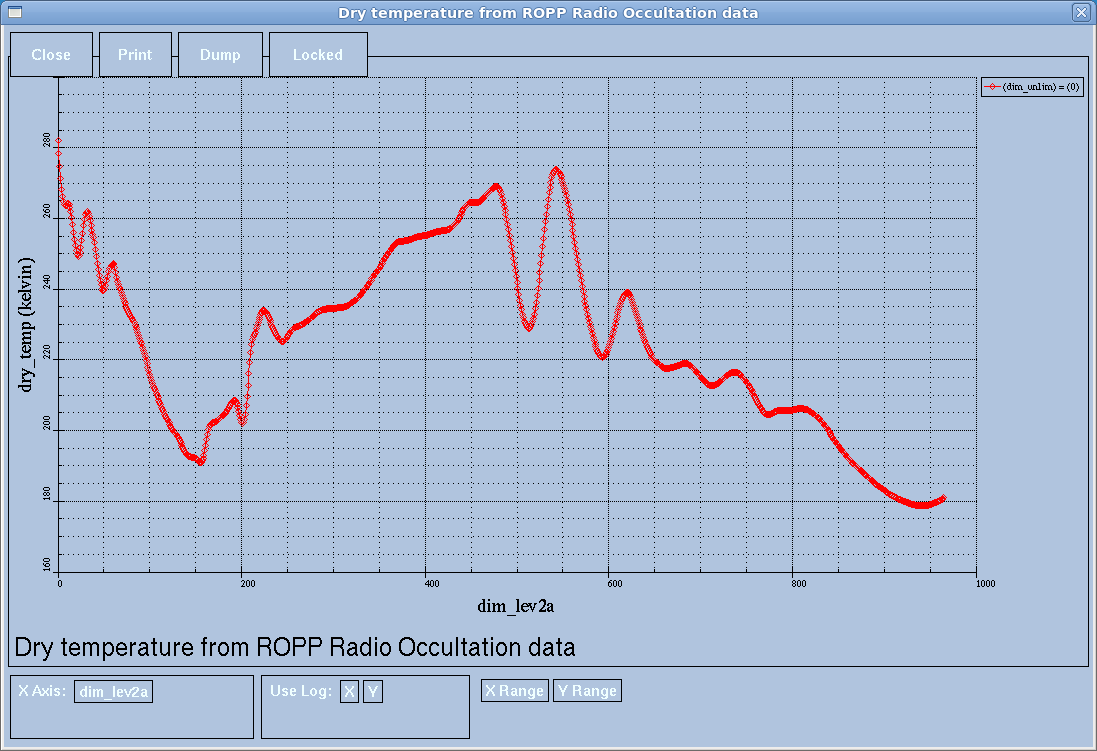
The resulting dry temperature profile is
Tdry atmPhs_C006.2010.002.06.40.G02_2010.2640

which is closer to the 'ROPP' dry temps in (the correctly labelled) Fig 4 than the 'CDAAC' dry temps. Ditto the bending angles and refractivities.
I don't have access to the CDAAC-processed data, but if Wang et al have processed that correctly, then there's a distinct difference between CDAAC and ROPP on this dataset.
Without access to the CDAAC processing software I don't know what more I can do about this.
by , 12 years ago
| Attachment: | atmPhs_C006.2010.002.06.40.G02_2010.2640_SNR_L2P.png added |
|---|
by , 12 years ago
| Attachment: | atmPhs_C006.2010.002.06.40.G02_2010.2640_Phase_L12.png added |
|---|
by , 12 years ago
| Attachment: | atmPhs_C006.2010.002.06.40.G02_2010.2640_Tdry.png added |
|---|
comment:2 by , 12 years ago
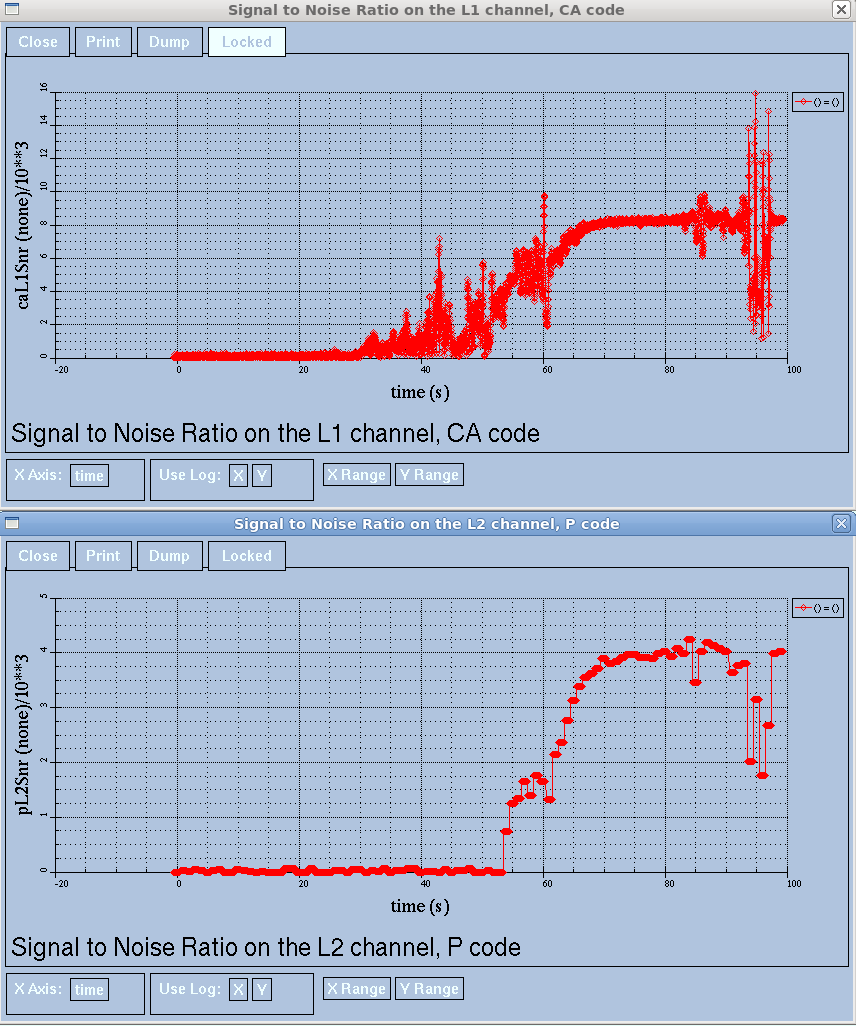
Stig Syndergaard (DMI) suggests that, in view of the mislabelling of Fig 3, the difference between CDAAC and ROPP may not be associated with L2 tracking, but possibly ionospheric scintillations from sporadic E layer instead. Here are the 'raw' CDAAC L1CA and L2P SNRs:
CDAAC L1CA and L2P SNRs atmPhs_C006.2010.002.06.40.G02_2010.2640

Note the spike in L1 CA SNR at about 61 sec, which coincides with the drop in the L2 SNR at that time. So it could be ionospheric scintillation noise that's causing the difference.
(I hadn't appreciated that the CDAAC L2P SNRs were sampled at 1 Hz. It's clear from Fig 2 that ROPP upscales these to 50 Hz, whereas CDAAC apparently works with the unadulterated 1 Hz data. Perhaps this has some effect.)
by , 12 years ago
| Attachment: | atmPhs_C006.2010.002.06.40.G02_2010.2640_SNR_L1CA_L2P.png added |
|---|
comment:3 by , 12 years ago
| Milestone: | 8.0 → DMI ROPP developments |
|---|
With Stig's permission moving milestone to DMI ROPP developments.
comment:4 by , 10 years ago
| Owner: | changed from to |
|---|---|
| Status: | new → accepted |

Preprint_CDACCvsROPP_figs2-4.pdf